Short Term Rally or More? By Van Tharp Trading Institute
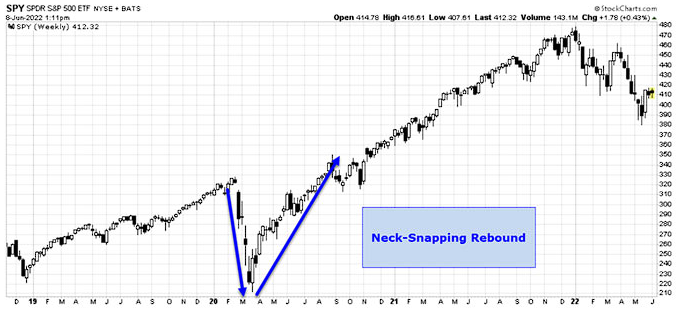
Just some quick thoughts today! The S&P 500 has managed what, at this stage, can be called a bear market rally of between 9% and 10%, including a 6.6% pop the last week of May. Many traders and investors are longing for the historically rapid push we saw after the March 2020 lows:
An analyst’s note from Stephen Suttmeier, out of Bank of America, earlier this week gave three conditions for this rally to continue. It was a bold enough call for us to take a look at each one to see if we can agree or not with his analysis.
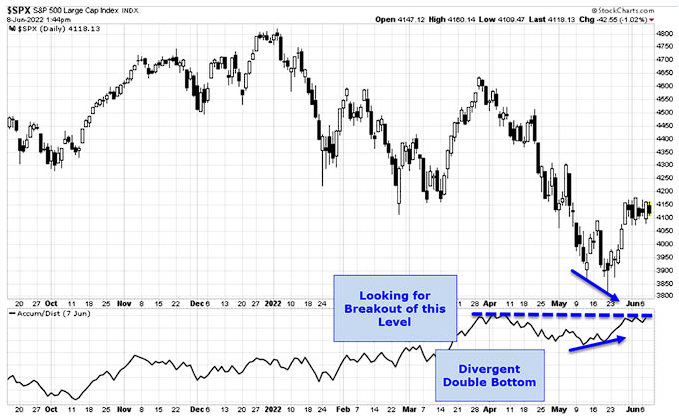
1) A breakout of the Advance-Decline (A-D) line. He used an A-D line of the most active stocks so he could show something proprietary, but we’ll use a standard A-D line. Also, note that the A-D line has a divergent short-term double bottom.
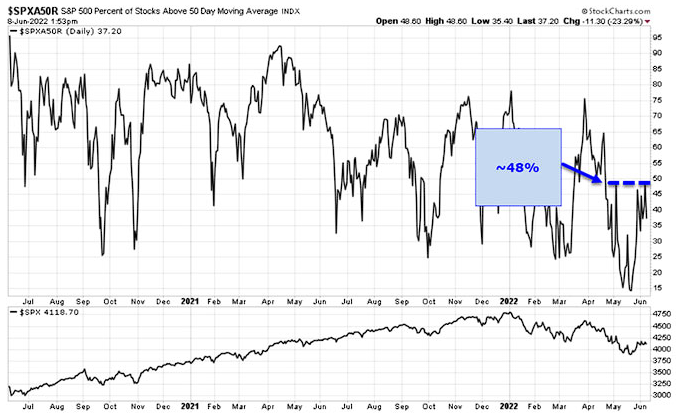
2) Next, he was looking for the percent of S&P 500 stocks trading above their 50-day moving average to break out above the ~48% resistance level on this chart. I can agree wholeheartedly with his reasoning here. Without some broad, intermediate-term upward momentum, the rally can’t be sustainable.
3) And lastly, he was looking for a long-term volatility to contract relative to short-term volatility. This one was quite reasonable as well.

Van Tharp Trading Institute Live Online Workshops Books Home Study Courses Free Resources Blog


