The Market at a Very Interesting Juncture By Van Tharp Trading Institute
Wednesday mornings are just about my favorite (well, for a weekday). That’s the time I usually prepare my notes to send to the production staff for my Thursday appearance on Varney & Co. Plus, I often use that same time in my thoughts for my contribution here at the Van Tharp Institute. It’s a full morning, but a time when I can really dig up something meaningful, useful, and actionable for hundreds of thousands of people. Plus, when I get to, I have a weekly Zoom call with an incredible group of friends where we do a study of Hebrew and Christian scripture, looking at context from culture, history, geography, archeology, and literature. So, yes, a truly favorite day of the week.
Most weeks, when I’m looking for talking and writing points, something has already caught my eye in my reading and research. And that was the case this week. Long-suffering readers know that I often like to look at market breadth – the number of stocks participating in a broader market move – to gain some insight into whether the move has further to run. And one of the most consistently useful tools I find for gauging this kind of wide follow-through is the cumulative breadth.
As a refresher, cumulative breadth is calculated like this: Each day, the NYSE reports an “advance-decline” number, which is simply the number of stocks that closed higher today than yesterday minus the number of stocks that closed lower. This number is also called by many simply “market breadth.” If you add those sequential daily breadth or advance-decline numbers together, you get a cumulative number.
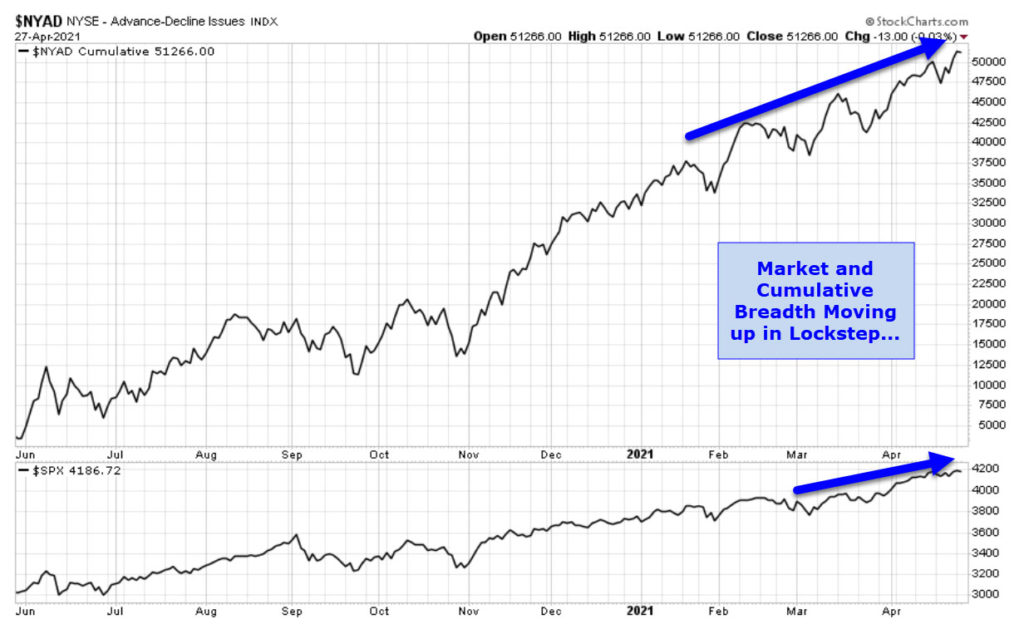
We’ve looked at this chart many times with the simple premise that when the market is making new highs, there is little danger of a massive sell-off if the cumulative advance-decline line is also making new highs.
That proved true 16 months ago when we looked at this very relationship:
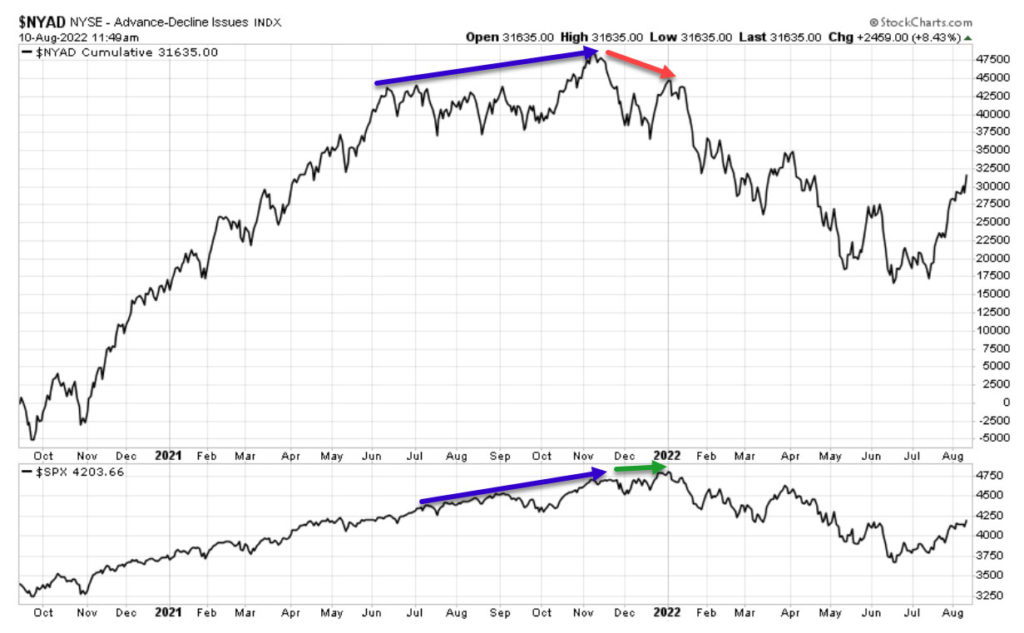
This relationship held right up until the new highs made in November of last year (as you can see on the chart below, outlined by the blue arrows):
However, after November of 2021, cumulative breadth declined (red arrow on the chart above) while the market continued to make new highs (green arrow on chart below). And that relationship of declining broad participation while the market made new highs was a negative signal for the market.
Now, we’re still far, far away from those all-time highs made at the first of the year.
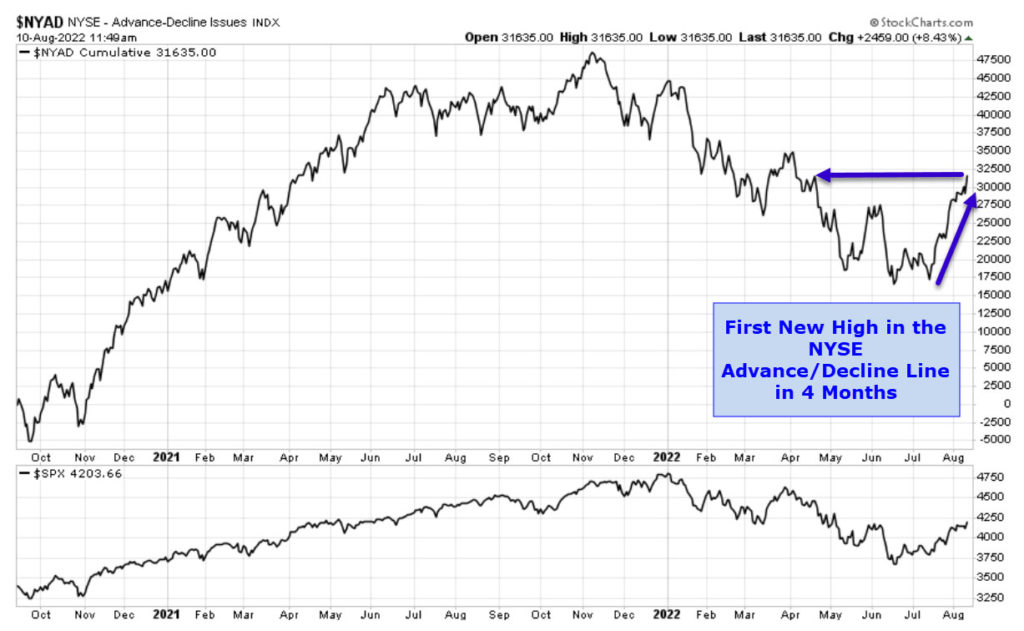
But the cumulative breadth gave us a more esoteric read this week. It made its first new high in four months:
Since 2010, this has only happened 7 times when the market wasn’t at an all-time high. And in 7 out of 7 times, the market was higher 12 months later, with an average double-digit percentage gain. Does this mean we should run out and buy the broader market indexes? Not necessarily. Monetary policy in the U.S. and worldwide is very different right now (we’ll learn more out of Jackson Hole, WY in the next two days). However, all other things being equal, having broad market participation in the rally that has occurred since June is a net positive.
Van Tharp Trading Institute Live Online Workshops Books Home Study Courses Free Resources Blog


