The USD King of Rock ‘n’ Roll! By Van Tharp Trading Institute
For most of 2022, the USD (DXY) king rocked, trending up by over 20%, defying gravity, sporting the equivalent of portfolio “blue suede shoes” – while other major assets collapsed!
But market history teaches us that the strongest trends often give way to the greatest falls once they inevitably roll.
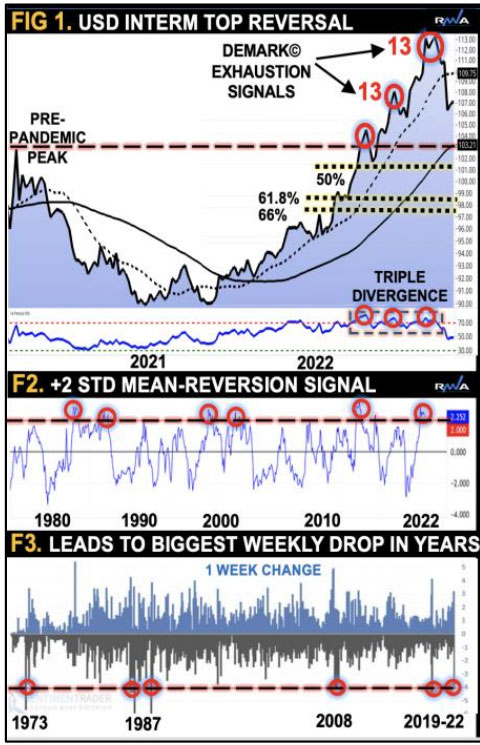
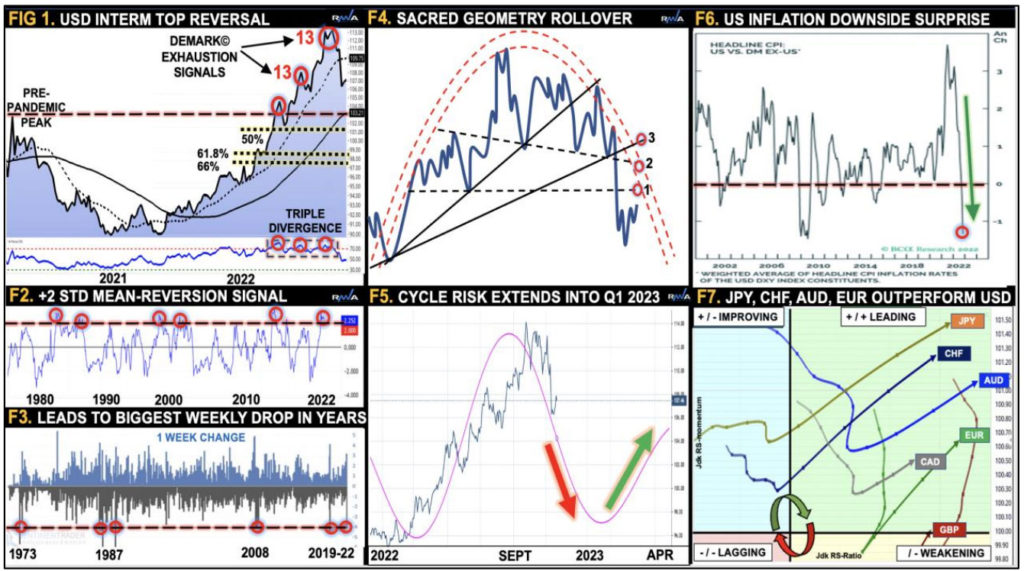
In a previous analysis, I shared three early warnings that led to a sizeable bull-trap capitulation, notably; DeMark© price exhaustion signals, momentum divergences (Figure 1), coupled with overcrowded positioning. In historical terms, this latest USD rock ‘n’ roll market dance was pivotal, having stretched by more than +2STD for only the sixth time in over 40 years (Figure 2)!
Consequentially, the price snapback led to one of the biggest weekly drops in years (Figure 3).
What next?
The USD’s behavioural pattern subconsciously traced out a sacred geometry which suggests a retest of point 1, 2 or 3, before rolling over once again into its pre-pandemic peak at 103 near 50% retrace at 102.30 (Figure 4).
One of our cycle models, based on spectral analysis, correctly predicted the USD downturn into year-end. It now extrapolates to Q1 2023 (Figure 5). Thereafter, a viable USD relief-rally is expected, likely fueled by renewed safe-haven flows as global sentiment turns back to risk-off mode in-line with our composite cycle work.
From a macro perspective, the USD shakeout followed US inflation surprises to the downside which is best seen as a weighted average of headline CPI inflation rates of the USD DXY constituents (Figure 6).
This requires two pillars – a growth rotation from the US towards other economies and inflation to subside much faster abroad. We continue to predict a new market regime for inflation and rates, “characterized by waves of volatility with a tentative high-low watermark [on US10YR] of 5% to 3%.”
Currently, rates have also carved an interim top, temporarily reversing to the lower boundary. Meanwhile, the decline in DXY is broadening, with major currencies such as JPY, CHF, AUD and EUR unwinding from oversold conditions (Figure 7).
Happy trading all and remember the importance of building synergy in your process to better understand these VUCA markets! Our big takeaway for readers is a timely market outlook and example of integrated analysis – which is taught in our scenario planning courses.
Van Tharp Trading Institute Live Online Workshops Books Home Study Courses Free Resources Blog


