The Nasdaq Trails – Now What? By Van Tharp Trading Institute
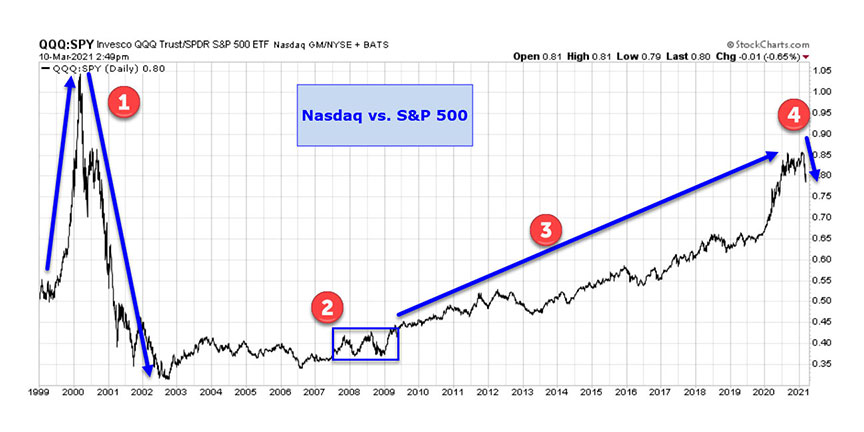
This week, let’s look at something short and sweet. The Nasdaq has been the go-to for overachievement in recent decades. Yes, it has been an up and down ride, especially if you go all the back to the Dot.com bubble, but the last 12 years have been largely a one-way ride:
The line presented in this chart illustrates the price of the Nasdaq ETF (QQQ) divided by the price of the S&P 500 ETF (SPY). If the line is heading up, the QQQ is outperforming; if it’s going down, the SPY is winning.
There are a few key areas on the chart, including one that surprised me:
- In the early part of the chart, the QQQ outperformed monstrously and then underperformed even more during the Dot.com boom and bust. I’m guessing that doesn’t surprise many people.
- During the Great Recession, given a fairly wide box, the QQQ and SPY were largely flat in their relative performance. That, I must say, really surprised me.
- From the end of the real estate bubble until the start of this year, the QQQ has once again shown huge outperformance (with a few periods of pullback). And with the rise of the mega tech stocks – MSFT, APPL, AMZN, GOOGL, and FB – this relentless drive up should not be a surprise to many.
- The recent negative ten percent correction should not come as a shock either, given how overheated the tech sector has become. This short-term sector rotation happened multiple times in 2020 – every time tech got overbought, it would drop back with industrials, materials, and financials taking the lead for a while (as is happening now).
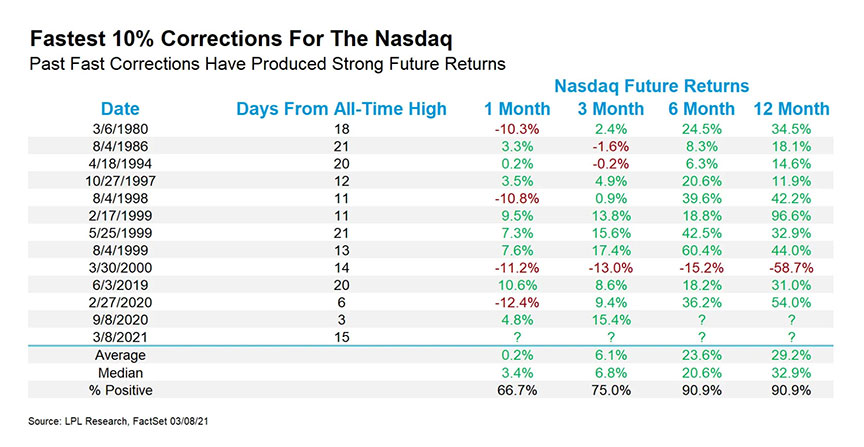
The drop in the tech sector was likely expected, but it was very fast. It took only 15 trading days to drop from the all-time highs to a -10% correction. But there is good news. As we can see from this data collected by LPL Financial, the follow-on after a rapid drop in the Nasdaq 100 has been quite positive. Here are the 12 corrections from all-time highs that took one month or less, dating back to 1980:
The results more than a month out are particularly impressive. And with new stimulus money on the way here in the U.S., you can bet a large chunk of that $1.9T will find its way into the stock market.
April 01 2021 Van Tharp Trading Institute Day Swing and Hybrid Trading Systems Workshops


