

Want to Learn How to “Read” a Price Chart? Start Here By Elliottwave International
See how Elliott wave patterns “subsume” other technical analysis chart patterns
Some investors who are fans of technical analysis may not realize that another way to look at many classic chart patterns — for example, Head and Shoulders — is to describe them in terms of Elliott waves.
What this means is that once you’ve learned Elliott wave analysis, by proxy you’ve learned most other technical analysis chart patterns that simply go by different names!
It’s a Huge Time Saver
In August and October 2005, as well as February 2006, Robert Prechter’s Elliott Wave Theorist discussed several chart patterns and showed two examples (with an introductory quote from the August 2005 Elliott Wave Theorist):
The acknowledged “bible” of traditional chart interpretation is Technical Analysis of Stock Trends (1948) by Robert Edwards and MIT alumnus John Magee. … The discussion here utilizes the fifth edition (1966).
Edwards and Magee collected others’ observations about chart patterns and added their own, producing a comprehensive list of forms against which we may compare related aspects of the Wave Principle. It may not be necessary that we undergo this exercise, as these authors observed and displayed these patterns exclusively in charts of individual stocks, not in the averages where the Wave Principle is deemed best to apply. Nevertheless, because many chartists use the same forms for general market interpretation and since the Wave Principle has some applicability to individual stocks, this exercise is important in order to determine if there are any valid market patterns outside the forms of the Wave Principle.
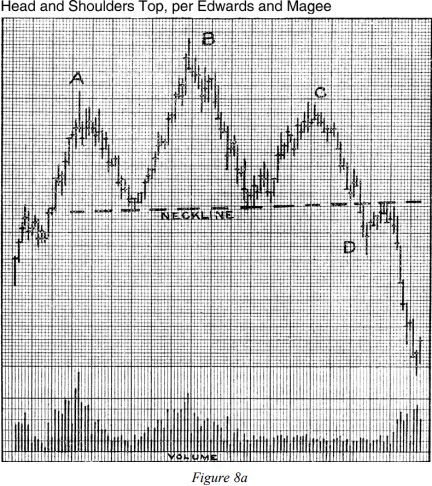
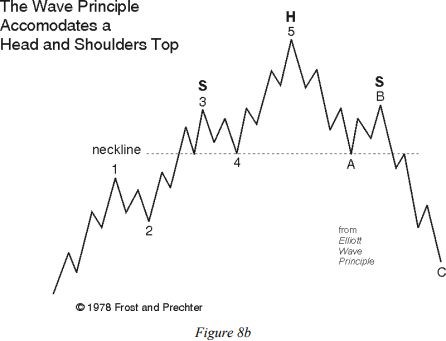
Head and Shoulders Top
Figure 8a shows Edwards and Magee’s depiction of a head and shoulders top, and Figure 8b is Figure 7-4 from Elliott Wave Principle. In a normal wave development, wave five of 3 and wave 4 form the “left shoulder” of the pattern, wave 5 and wave A form the “head,” and wave B and wave one of C form the “right shoulder.” Wave two of C creates the return to the neckline that is typical of the pattern.
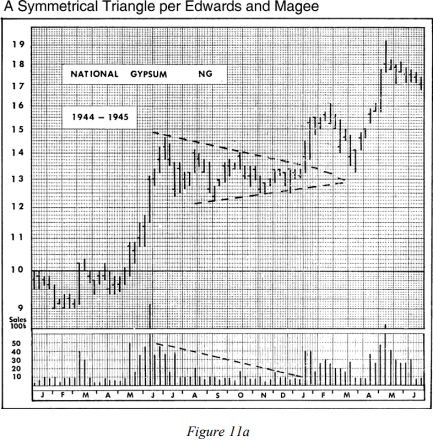
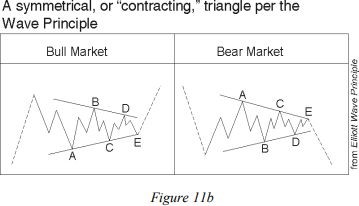
Symmetrical Triangle
The Wave Principle covers the chartist’s “symmetrical triangle.” As you can see in Figures 11a and 11b, Edwards and Magee’s example is a perfect rendition of Elliott’s description, right down to the five subwaves.
Edwards and Magee claim, “Prices may move out of a Symmetrical Triangle either up or down. There is seldom if ever…any clue as to the direction….” Elliott’s form is more specifically defined, and its position in the market structure and therefore its implications are more definite.
Even though just two examples were shown here, hopefully, you get a flavor of what was presented in 2005 and 2006 — and an idea of the quality of analysis which our Financial Forecast Service regularly offers.
Realize that a chart pattern — even though it’s “classic” — offers no guarantees — and the same with the Wave Principle.
Yet, keep in mind this adaptation of a Q&A with Robert Prechter from an issue of The Elliott Wave Theorist:
Q: Do you believe that the Wave Principle provides for an objective form of analysis? Two different people can look at the same chart and derive very different wave counts. There are market watchers who say that applying wave theory is very subjective.
A: I always ask, “compared to what?” There is no group more subjective than conventional analysts who look at the same “fundamental” news event [like] a war, the level of interest rates, the P/E ratio, GDP reports, the President’s economic policy, the Fed’s monetary policy, you name it and come up with countless opposing conclusions. They generally don’t even bother to study the data. The Wave Principle is an excellent basis for assessing probabilities regarding future market movement. Probabilities are by nature different from certainties. Some people misinterpret this aspect of analysis as subjectivity, but all probabilities may be put in order objectively according to the rules and guidelines of wave formation.
If you’re unfamiliar with Elliott wave analysis, read Frost & Prechter’s Elliott Wave Principle: Key to Market Behavior, which is the definitive text on the subject. Here’s a quote from the book:
Ralph N. Elliott recognized that not news, but something else forms the patterns evident in the market. Generally speaking, the important analytical question is not the news per se, but the importance the market places or appears to place on the news. In periods of increasing optimism, the market’s apparent reaction to an item of news is often different from what it would have been if the market were in a downtrend. It is easy to label the progression of Elliott waves on a historical price chart, but it is impossible to pick out, say, the occurrences of war, the most dramatic of human activities, on the basis of recorded stock market action. The psychology of the market in relation to the news, then, is sometimes useful, especially when the market acts contrarily to what one would “normally” expect.
If you’d like to read the entire online version you can get complimentary access by following this link >>> Elliott Wave Principle: Key to Market Behavior