

Ponder These 2 Key Stock-Market Valuation Metrics By Elliottwave International
Most people in their right minds would not overpay for a consumer item. Yet, the brains of those same people work differently when it comes to the stock market. Here’s what I’m talking about (courtesy of the February Elliott Wave Financial Forecast):
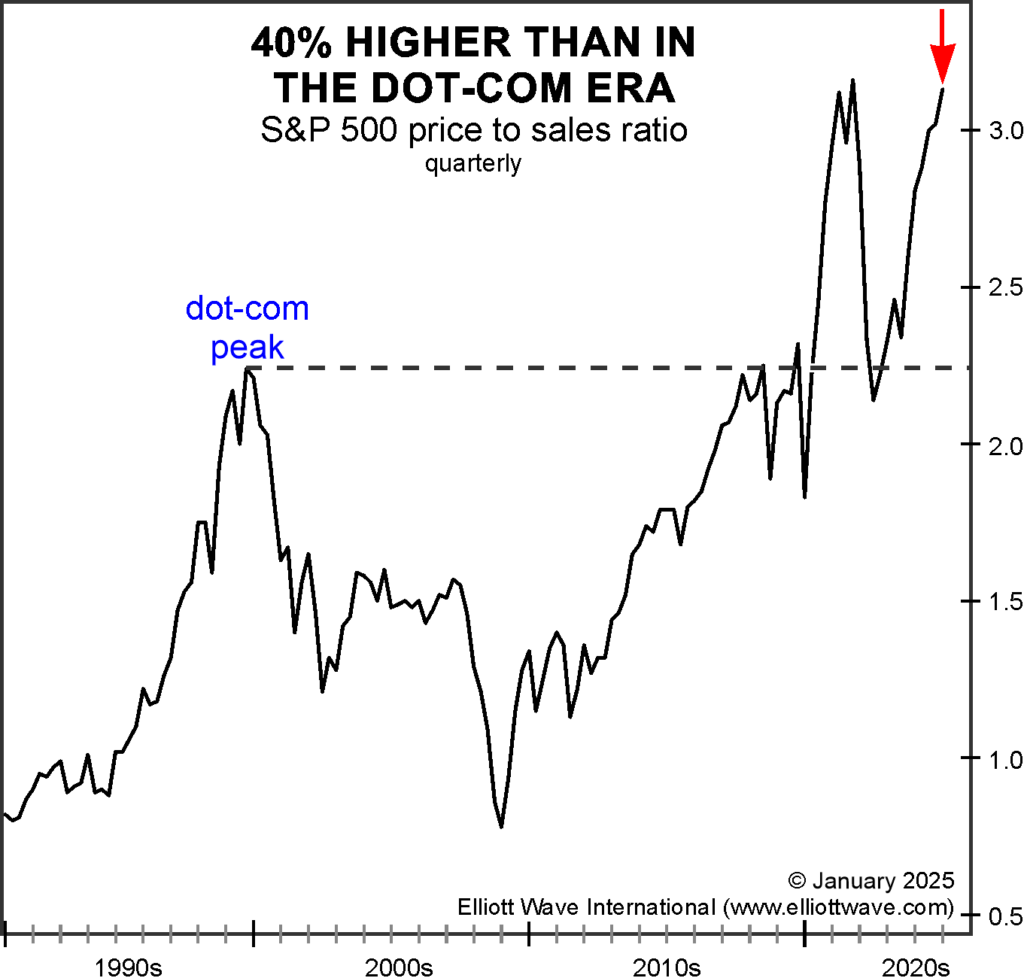
The chart below shows that the S&P 500 price-to-sales ratio is 3.1, meaning that investors are willing to pay over $3 for every dollar of sales generated by the index’s companies. This is 40% higher than at the end of the dot-com boom in 2000:
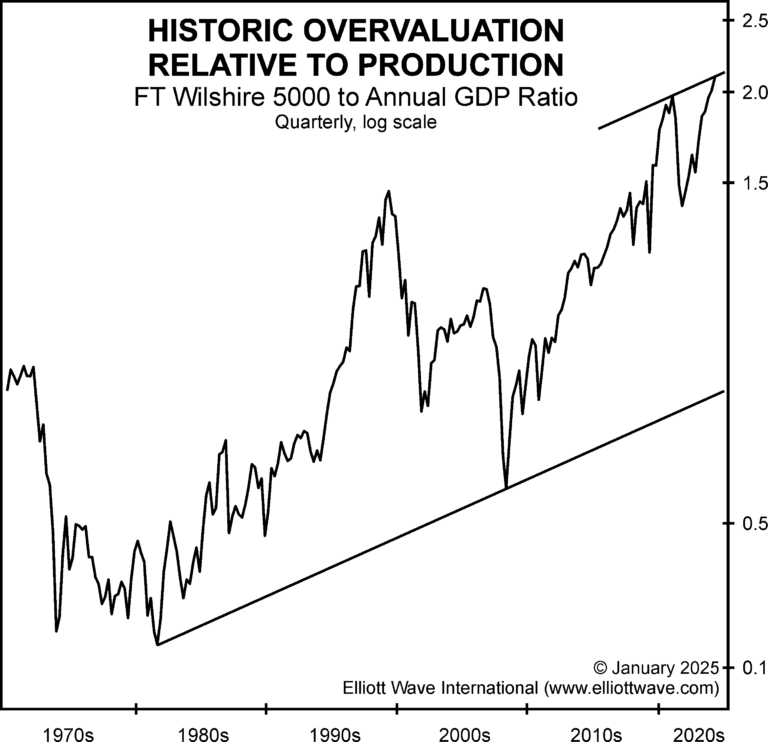
The next chart below shows another key valuation ratio: the FT Wilshire 5000, the broadest measure of U.S. stock market performance, relative to annual U.S. GDP. The current ratio is 2.05, a record extreme over the past half century. The most recent important development is the ratio’s intersection with the resistance line of its long term channel. The channel starts at the key low in August 1982 and connects to the low in March 2009. These are two of the most memorable low points for stock prices. The top channel line comes off the extreme in December 2021, the month between the highs in the NASDAQ indexes and the Dow and S&P 500:
Keep in mind that today’s extreme valuations do not mean that the stock market will collapse immediately. Nor do they mean that it won’t! Valuations are not meant to be used for precision market timing. Yet, the market’s Elliott wave pattern reveals insights which investors need to know now. Get those insights from our flagship services right away by following this link.
If you would like to learn the details of Elliott wave analysis before subscribing, you can get free access to the online version of Frost & Prechter’s Elliott Wave Principle: Key to Market Behavior.