A New Class of Risk On Assets By Van Tharp Trading Institute
Back in 2019, I wrote of series of articles about bitcoin and declared that traders and investors were treating it as its own asset class.
That part has not changed. When we look at bitcoin action today, it does not directly correlate for any length of time with any other asset class.
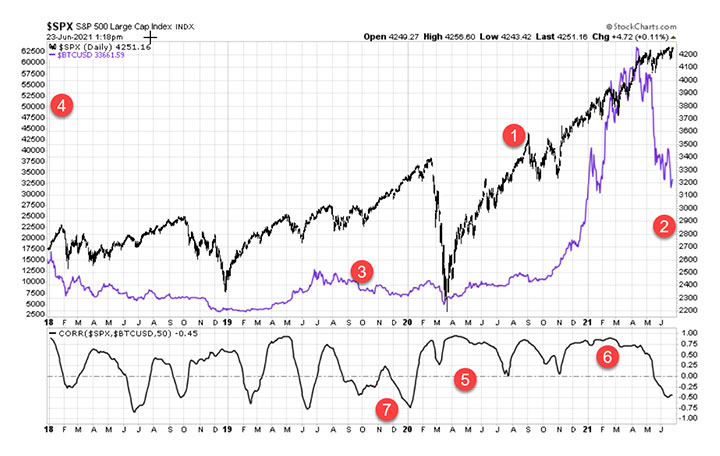
But what is interesting (and tradeable) is the cycle that crypto has with the S&P 500—from negatively correlated (moving in opposite directions), to uncorrelated (price moves having no relationship to each other), to moderately correlated (prices moving together much of the time) and then back again.
When bitcoin hit its all-time highs back in April, it was the longest period of moderately high correlation that it has had in the last three years.
I believe the reason is very simple. This period of the first few months of 2021 saw every asset class appreciate as lots of new money poured into the system. This money came both from the Fed (low rates and monthly $120B in bond and mortgage purchases) and from congress (stimmies for everyone!). So everything went up. Real estate, new and used cars, lumber, gold – you name it and, it was probably going up.
But since then, the game has changed. Take a look at this very busy chart that shows the correlation between the S&P 500 and bitcoin:
Notes for Red Circles above:
1 & 2: #1 is the dark line and is the S&P 500 index and #2 shows its scale on the right sides of the chart.
3 & 4: #3 is the purple line and is the price of bitcoin in US dollars and #4 shows that its scale on the left side of the chart.
5: This is the scale for the correlation coefficient between the S&P 500 and bitcoin. The scale runs from the highest level of 1.00, which would mean perfect correlation or that the two instruments always move in the same direction. A reading of -1.00 is a perfect inverse correlation, meaning that the two instruments always move in the opposite direction of each other. A reading of 0 means non-correlated or that the two have no relationship to each other.
6: You can see that the S&P 500 index and bitcoin are fairly highly correlated for this five-month stretch described above.
7: Periods of lower negative correlation happen often, like at the end of 2019 and January 2020 when the S&P was rocketing to new highs and bitcoin was struggling to remain flat.
At the hard right edge of the chart, we see bitcoin crashing while the S&P hits still more all-time highs.
During that same time frame, lots of those high volatility risk-on assets have come crashing back to earth. But the rotation out of the most volatile assets (bitcoin and meme stocks, for example) and back into the megatech stocks (AMZN, APPL, FB, GOOGL, MSFT) has shown that risk tolerance is not gone – it’s just slightly less and rotated into a more traditional risk-on space.
I look for this dance between bitcoin/meme stocks and the mega techs to continue into the fall. What’s good for one will be bad for the other and vice versa. And I believe that trading this almost like a pairs trade will be a quite interesting way to play it.
July 01 Van Tharp Trading Institute Day Swing and Hybrid Trading Systems Streaming Workshops


