Roided-Up Investors By Elliottwave International
Are YOU leveraged to the hilt? Our recently published Elliott Wave Financial Forecast says, “Watch out!”:
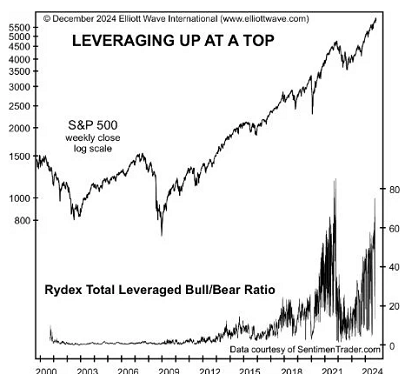
The use of debt to juice returns is one of the great stock-market-peak indicators, because it shows in hard money terms the extent to which investors are willing to use other people’s money to buy stocks in hopes of making “way more” than their own initial outlay. At the very end of large bull markets, this attitude can be the supreme measure of confidence. The chart below shows the Rydex Total Leveraged Bull/Bear Ratio, which soared on Dec. 4 to within a few points of its all-time high:
The ratio reveals that leveraged Rydex investors have 79.8 times more money betting on a rise in the S&P than on a decline. The unrivaled nature of this risk orientation is discernible by the fact that Rydex’s non-leveraged Bull/Bear Ratio is 53, currently 34% lower than the leveraged ratio. As we also explained last month, high levels of “synthetic leverage” and the unprecedented popularity of assets such as “derivative fueled ETF products” reveal that leveraged exposure is surely higher than ever. NYSE Margin Debt peaked in October 2021. After sliding with the decline into late 2022, margin debt is climbing again, to $815 billion. NYSE margin is down 13% from the October 2021 high, but total leverage is clearly running at all-time highs due to leverage that is baked into many new financial products such as the leveraged ETFs shown on page 3. Due to the proliferation of exotic margin instruments, there is no way of knowing the full extent of global exposure. But this Bloomberg headline from November 22 suggests it is already higher than most people can imagine:
Gamblers Are Sinking Billions into Leveraged Market Fringe
The “fringe” aspect confirms that we may never know the final total. We are quite sure, however, that moments after margin debt reaches its upside limit, its wane will manifest in the form of rapidly declining stock prices. The forced sale of other unrelated assets due to margin calls will intensify the decline.
When you use sentiment indicators – such as investors’ use of leverage – in conjunction with Elliott wave analysis, an even clearer stock-market picture emerges. Get our Elliott wave analysis of the S&P 500 index, Dow Jones Utility Average and the Dow Jones Transportation Average by following this link.
If you want to brush up on your knowledge of Elliott wave analysis, read Frost & Prechter’s Wall Street bestseller, Elliott Wave Principle: Key to Market Behavior. The online version of the book is FREE when you access it via this link.

