Should You Prepare Your Portfolio for ‘The Roaring 2020s’? By Elliottwave International
After all, market valuation measures such as PE have reached an extreme.
Well, the answer posed by the question in the title is a resounding “yes!” — according to the British financial magazine, MoneyWeek.
The cover of the Dec. 4 issue of the magazine is titled “The Roaring 2020s, Prepare Your Portfolio for a Boom.” An image of Janet Yellen is front and center. Of course, she’s the former Federal Reserve chair and the reported pick for Treasury Secretary in a new administration. She’s dressed in a 1920s party outfit and looks very festive.
Yet, stock market valuations are different when you compare the start of the 1920s with the 2020s in the U.S. Here’s a quote from the December Elliott Wave Financial Forecast, a monthly publication which provides analysis of major U.S. financial markets:
As the bull market began in August 1921, the S&P 500 price-to-earnings ratio was 14. In September 1926, three years before the 1929 peak, the market’s p/e ratio was 10.72, even more subdued than in 1921. By the time that September 1929 arrived, the market’s p/e ratio had jumped to 20.17. At the February high this year, the S&P 500’s p/e ratio was 25.43. By December 1, it was an even higher 36.67. Other market valuation measures are just as extreme.
Even so, the extreme optimism conveyed on the MoneyWeek cover is also reflected in a recent survey of market strategists. Here’s a quote from a Dec. 8 CNBC article:
A majority of analysts surveyed by CNBC expect [an] 8%-22% upside for the S&P 500 in 2021.
There are other signs of extreme bullish sentiment.
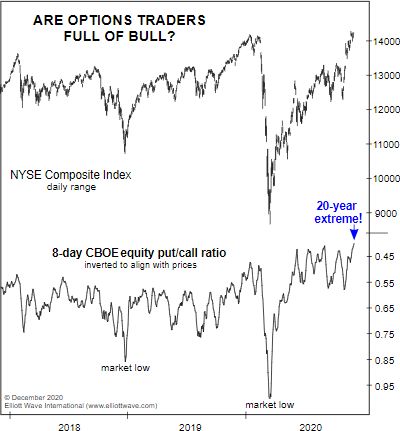
Here’s just one of them as we return to the December Elliott Wave Financial Forecast with this chart and commentary:
The option markets offer further evidence of intense speculation. The 8-day CBOE equity put/call ratio declined to .40 on Wednesday, the most extreme level of call buying to put buying in over 20 years. The last time the 8-day p/c ratio was lower was July 18, 2000, at the top of the initial rebound in the NASDAQ’s bear market from March 2000 to October 2002.
Sentiment measures are just one way to take the market’s temperature. Another, more immediate way to look directly at the patterns of investor psychology is reflected in price charts.
That’s what our December Elliott Wave Financial Forecast does for you: Namely, it describes how current sentiment measures align with the stock market’s Elliott wave pattern.
So you get a complete, and immediate market snapshot — and a clear idea as to what’s likely next.
This analysis will help you ascertain whether stocks are near the start of a bull market (like the early 1920s) or much further down the road.
Get the Elliott wave insights you need to know by joining our free 5-day event End-of-Year Market View “From 30,000 Feet.”
Each day through December 18, you get an excerpt from our 10-page December 2020 Elliott Wave Financial Forecast. By Friday, you will get the entire issue at no charge.
Free Financial Forecast December 14 – 18


