Severe Bear Market: Will You Be Among the Prepared 1.5%? By Elliottwave International
“Oftentimes, rallies will end with an inter-index non-confirmation”
A long-long time ago in a galaxy far away… errr, on the heels of the year 2000 dot-com crash, to be exact — which is ancient history for many investors today — the February 2003 Elliott Wave Theorist, a monthly publication which has covered financial markets and major cultural trends since 1979, published an interview with Elliott Wave International President Robert Prechter.
Prechter was asked if he was surprised by investors’ lack of capitulation since the bear market started in 2000.
Prechter replied:
I read a statistic that said no more than 1 to 1½% of investors actually got out. This is utterly typical. The average investor stays in. [emphasis added]
This is mentioned because the patterns of investor psychology tend to repeat, which is the entire basis of Elliott wave analysis, which helps you track those patterns on the scale from intraday to multi-century.
So, with that in mind, consider what the July 2022 Elliott Wave Financial Forecast, a monthly publication which focuses on major U.S. financial markets, says:
Even as stocks fell hard into the middle of June, the bullish resolve of investors remained on display. On June 14, for instance, Bloomberg reported that “Undeterred Retail Traders Piled into Stocks.”
The chances are high that many of these investors will hold onto their stocks into the worst part of the bear market, if indeed the January top in stocks marked the end of the long bull market.
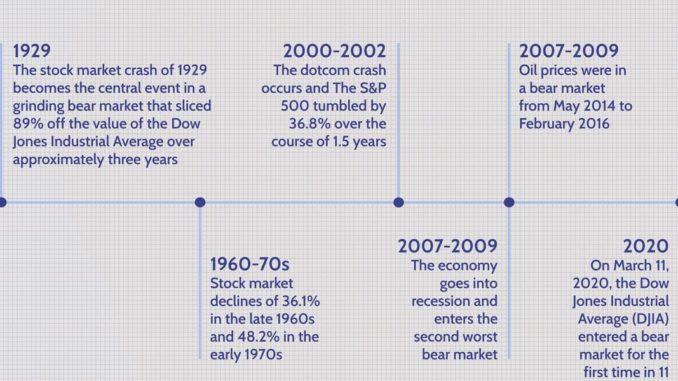
By one measure, investors know that the S&P 500 had already suffered at least a minimum bear market because in June, the index had declined 25% from its January all-time high. Of course, a 20% decline is widely considered to be the “official” entry into a bear market.
Since June 17, however, the index has rallied.
The question is: Is the bear market over, or is the price climb since June 17 a countertrend rally in a bigger bear market?
Well, if indeed the rally is countertrend, the August 1 U.S. Short Term Update, a thrice weekly Elliott Wave International publication which offers near-term analysis of key U.S. financial markets, provided a clue on how to possibly ascertain the end of the rally:
Oftentimes, rallies will end with an inter-index non-confirmation, where one or more stock index will fail to confirm the final rally high in the other indexes.
Elliott Wave International’s analysts show you where the various related indexes are right now in relation to each other in EWI’s publications. EWI’s analysts also show what the Elliott wave model is revealing about the price pattern of the main indexes.
The whole idea is to make sure you’re among the 1.5% of investors who are on the sidelines if a bigger bear market has yet to unfold.
If you’re new to Elliott wave analysis, you are encouraged to read Frost & Prechter’s Wall Street classic, Elliott Wave Principle: Key to Market Behavior. Here’s a quote from the book:
After you have acquired an Elliott “touch,” it will be forever with you, just as a child who learns to ride a bicycle never forgets. Thereafter, catching a turn becomes a fairly common experience and not really too difficult. Furthermore, by giving you a feeling of confidence as to where you are in the progress of the market, a knowledge of Elliott can prepare you psychologically for the fluctuating nature of price movement and free you from sharing the widely practiced analytical error of forever projecting today’s trends linearly into the future. Most important, the Wave Principle often indicates in advance the relative magnitude of the next period of market progress or regress. Living in harmony with those trends can make the difference between success and failure in financial affairs.
Why Wave Analysis Belongs in Every Trader’s Toolbox

